
Huginn
Your Mac's health, at a glance.
A native system monitor in the menu bar. Temperatures, load, memory, storage, network and power — and one dot that tells you when something is off.
Download macOS 15+ · Menu bar & widgetEverything that matters, on one screen.
CPU and SSD temperatures, CPU and GPU load, memory with its pressure, storage, network throughput and power draw, each with its chart. Switch between the last two minutes, the last hour and the last 24 hours, and see which apps weigh the most on CPU and memory.
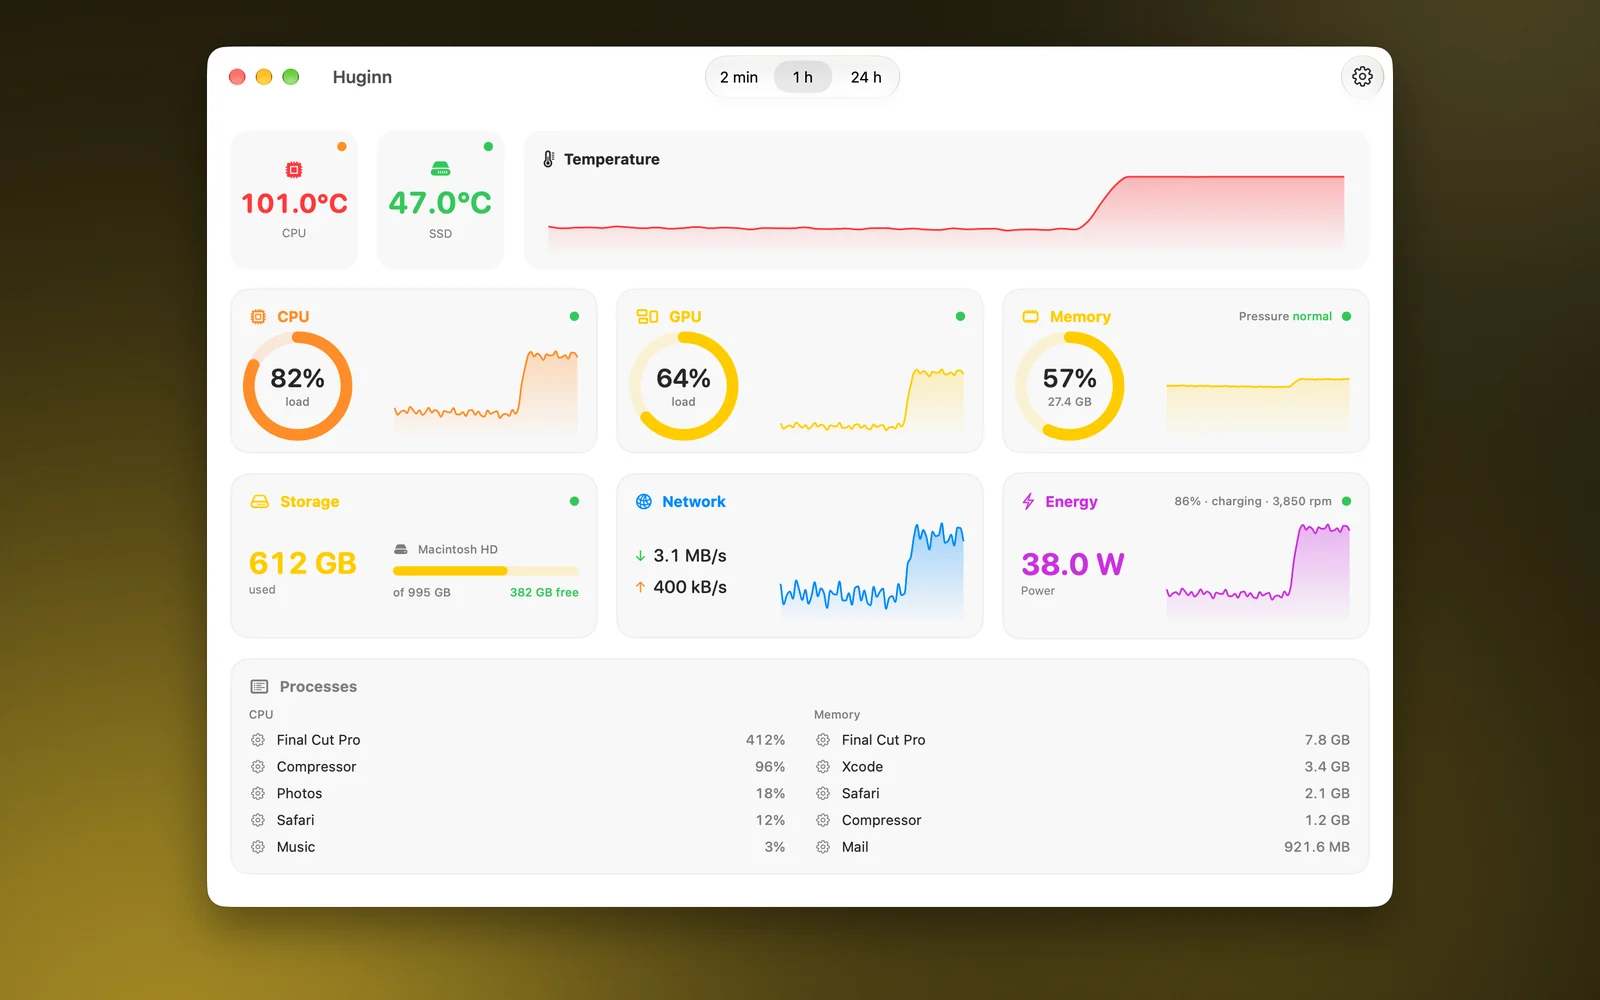
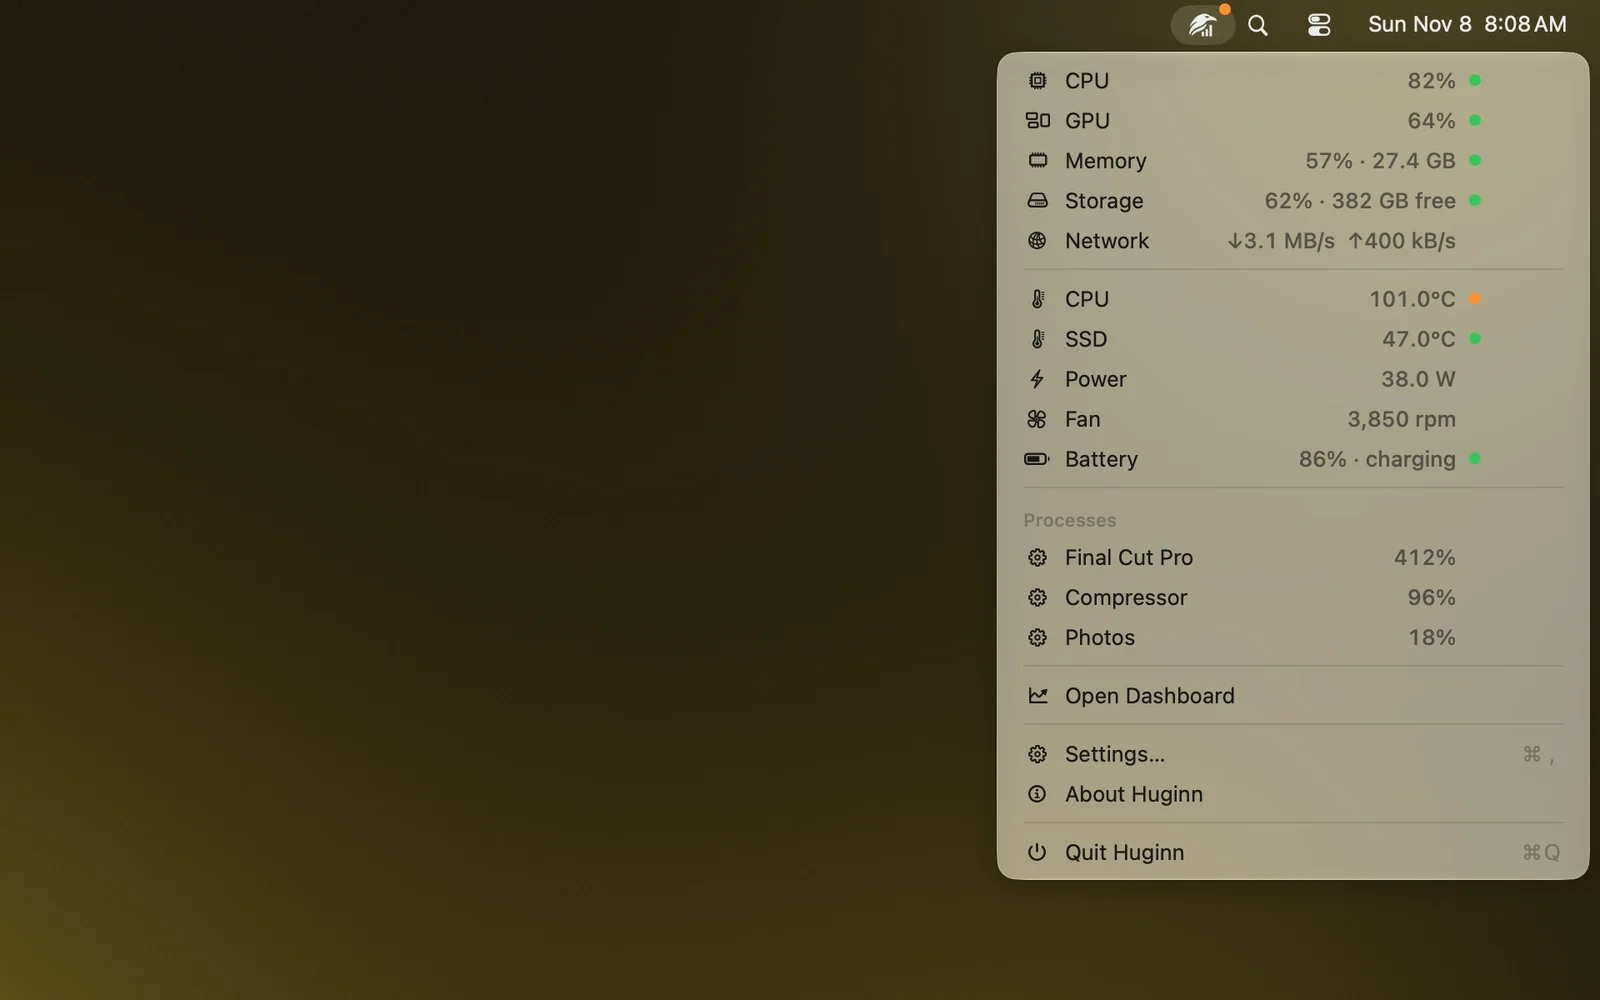
One dot. Green means all is well.
Huginn watches every reading and colours its menu-bar dot green, yellow, orange or red. Thresholds carry hysteresis and a short delay, so a brief spike never raises a false alarm. Choose which readings count and set your own critical temperature.
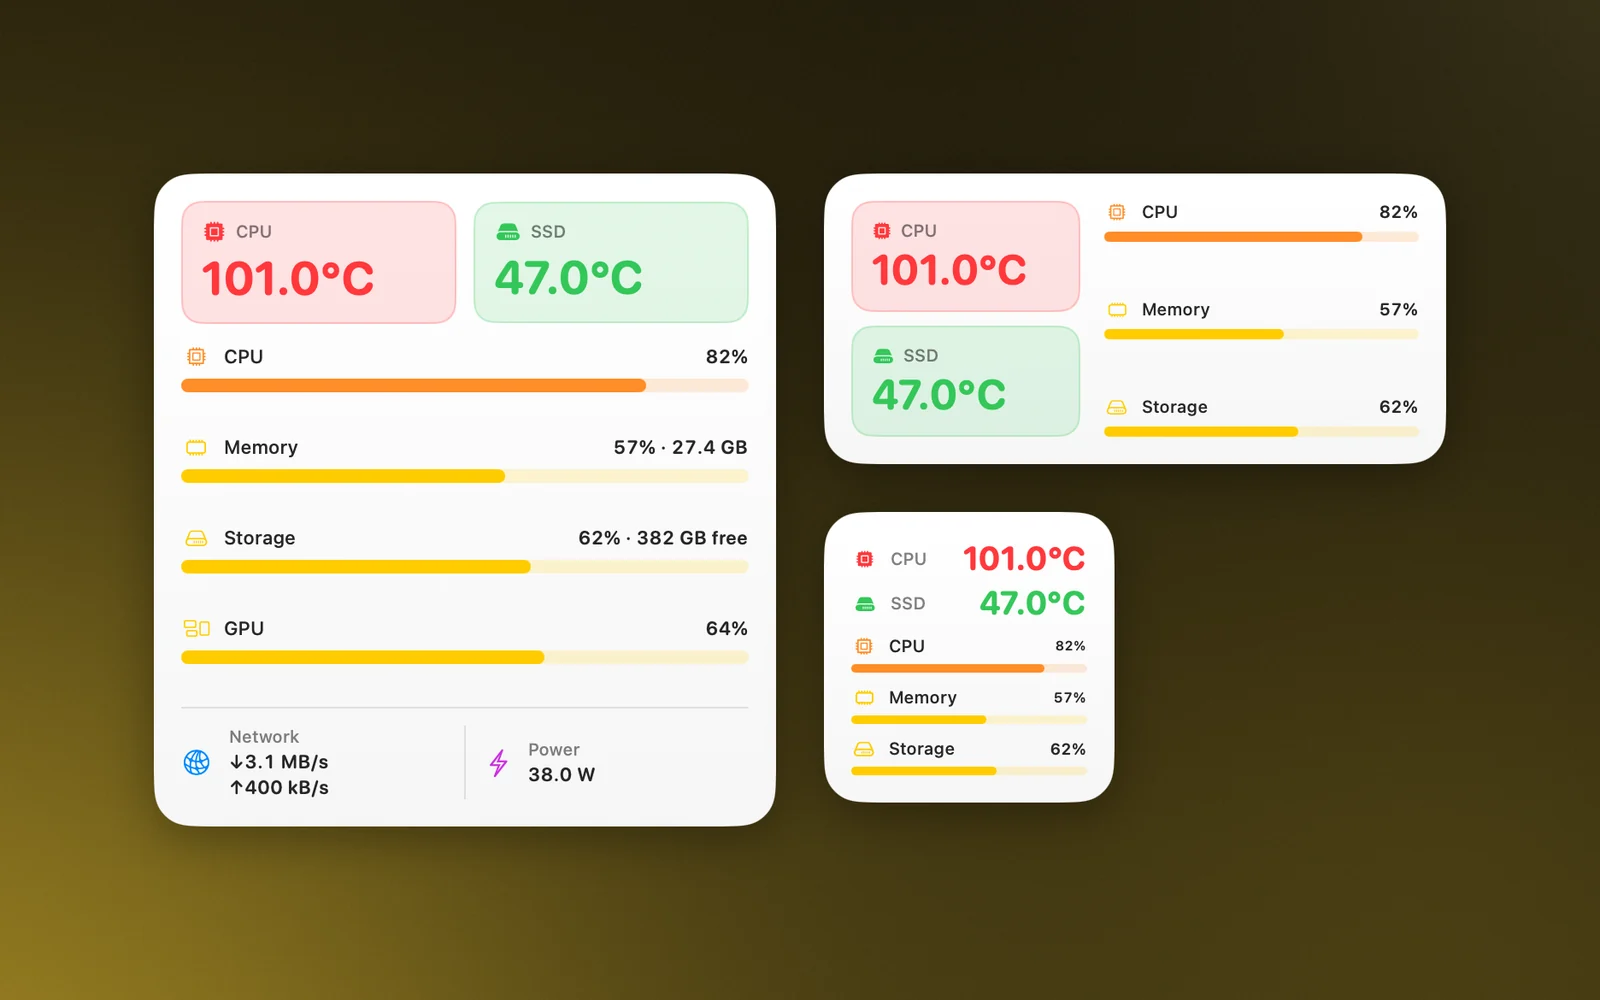
Your Mac's vitals, right on the desktop.
Three sizes for your desktop or Notification Center, with the same status dot in the corner. The widget shows its age when the readings get old, and opens the dashboard in one click.
Built to watch, not to weigh
Temperatures
CPU and SSD temperatures read straight from the Mac's sensors, plus fan speed.
Load & pressure
CPU, GPU, memory pressure as macOS reports it, storage and network throughput.
24-hour history
One point a minute over the last day, kept across restarts. Gaps show when the Mac was asleep.
Top processes
The apps using the most CPU and memory, right in the dashboard and the menu.
Light by design
Samples every 2 seconds while you look, every 10 seconds otherwise, and slows down further in Low Power Mode.
Native macOS
Built with Swift and SwiftUI. Optional temperature or CPU load next to the menu-bar icon.
Available Languages
Your Mac. Your readings. Nowhere else.
Huginn reads your Mac's sensors locally and keeps its history on your Mac. No account, no network connection, no analytics, no telemetry. Requires macOS 15 Sequoia or later.